
Fitness · Research
Training load and fiber type: lighter loads leaned toward type I growth, heavier loads toward type II, but every interval included zero
A 2026 systematic review and meta-regression pooled 8 muscle biopsy studies with 195 participants to ask whether training load changes how much type I and type II fibers grow. With both fiber types combined, the data were insufficient to show an effect of load; split by fiber type, the estimates leaned toward type I at lighter loads and type II at heavier loads, but every 95% CI included zero.
The short version
This 2026 systematic review and meta-regression in Frontiers in Physiology asked a narrow question. Does training load, written as a percentage of one-repetition maximum (%1RM), change how much type I and type II muscle fibers grow? It pooled 8 randomized studies, 195 participants in all, that took muscle biopsies before and after resistance training.
With both fiber types put together, load made no clear difference. The model's average fiber growth was 0.489 SMC (95% CI 0.297 to 0.682), and adding load to the model gave no extra evidence beyond study design. SMC stands for standardized mean change: the change in fiber size from before to after training, divided by the spread (standard deviation) of the pre-training values, with a small-sample adjustment. It puts studies that measured fibers in different ways on one scale. The paper reads below 0.20 as trivial, 0.20–0.49 as small, 0.50–0.79 as moderate and 0.80 or more as large.
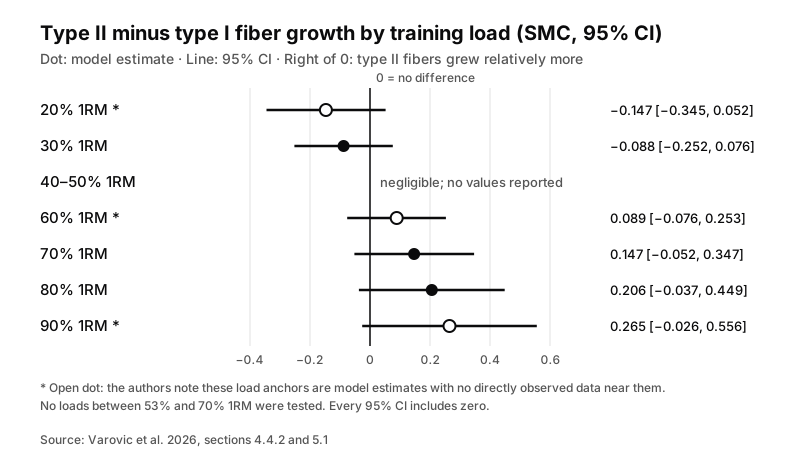
Split by fiber type, a pattern appeared. At 20–30% 1RM the estimates leaned toward more type I growth. From 60% to 90% 1RM they leaned toward more type II growth, rising from 0.089 to 0.265 SMC. Every one of those contrasts had a 95% confidence interval (CI) that included zero, and the authors call the estimates exploratory and hypothesis-generating. It's a tendency in the data, and the paper doesn't claim more than that.
“When both fiber types were combined, the available data were insufficient to determine a meaningful effect of training load on hypertrophy.”
Varovic et al. · Conclusions · full text
What the researchers did
Most heavy-versus-light studies measure the whole muscle with ultrasound or MRI. That comparison is covered in the site's article on load and repetition ranges. This review went one level down, to the fibers themselves, because whole-muscle scans can't show which fiber type grew.
“Still, it should be noted that these findings are specific to studies using assessment tools such as ultrasound or magnetic resonance imaging, which do not provide insight into the adaptations occurring at the muscle fiber level (Haun et al., 2019).”
Varovic et al. · Introduction · full text
The team searched PubMed/MEDLINE, Scopus and SPORTDiscus, plus a thesis database and citation lists, and a later updated search found no new studies. To qualify, a study had to randomize adults under 60 with no known medical conditions or injuries, run resistance training lasting a minimum of 4 weeks, compare at least two training loads, and measure fiber cross-sectional area by biopsy before and after. Eight studies made it in: five from earlier meta-analyses and three added here (Mackey 2011, Cumming 2025, Lees 2025).
Samples were small, 12 to 49 people per study (median 20). All participants were young adults, with reported ages of 20.8–25.0 years. Six studies were male-only, one female-only and one mixed. Six used untrained people and two used trained people. Training lasted 9.6 ± 2.0 weeks. Every biopsy came from the vastus lateralis, seven of the eight studies used lower-body exercises, and all but one study (Mackey 2011) had people train to failure.
Studies reported loads as rep ranges (like 3–5 RM) or %1RM ranges, and exact loads were rare. The authors used the midpoint of each range. For the one study that gave only rep ranges (Campos 2002), they converted reps to an estimated %1RM with a published meta-regression. That left 12 distinct loads from 15.5% to 92.5% 1RM, with none between 53% and 70%.
They then fit multilevel meta-regressions with load as a continuous number, instead of sorting studies into light and heavy groups. Linear and linear-log models fit about equally well, so they kept the simpler linear model. From it they estimated each fiber type's growth at load anchors from 20% to 90% 1RM and computed the pairwise contrast: type II growth minus type I growth. A positive contrast means type II fibers grew relatively more.
Key findings
| Measure | Estimate | 95% CI | Location |
|---|---|---|---|
| Both fiber types combined: estimated marginal mean | 0.489 SMC | 0.297 to 0.682 (95% PI −0.364 to 1.343) | 4.4.1 |
| Load slope, type II fibers (per 10 percentage points of %1RM) | 0.054 | −0.038 to 0.145 | 4.4.2; Discussion |
| Load slope, type I fibers (per 10 percentage points of %1RM) | −0.005 | −0.082 to 0.072 | 4.4.2; Discussion |
| Contrast at 20% 1RM * | −0.147 SMC | −0.345 to 0.052 | 4.4.2 |
| Contrast at 30% 1RM | −0.088 SMC | −0.252 to 0.076 | 4.4.2 |
| Contrast at 40–50% 1RM | negligible | no values reported | 4.4.2 |
| Contrast at 60% 1RM * | 0.089 SMC | −0.076 to 0.253 | 4.4.2 |
| Contrast at 70% 1RM | 0.147 SMC | −0.052 to 0.347 | 4.4.2 |
| Contrast at 80% 1RM | 0.206 SMC | −0.037 to 0.449 | 4.4.2 |
| Contrast at 90% 1RM * | 0.265 SMC | −0.026 to 0.556 | 4.4.2 |
| Sensitivity model (aggregated type II only): type II slope | 0.019 | −0.016 to 0.055 | 4.5.1 |
| Sensitivity model (aggregated type II only): type I slope | −0.017 | −0.052 to 0.019 | 4.5.1 |
| Leave-one-out: load × fiber type interaction | 0.043 to 0.069 across 8 runs | excluded zero in 2 of 8 runs | 4.5.2 |
| Residual heterogeneity, fiber-type model | I² 69.4% (moderate) | – | 4.4.2 |
| Source: Varovic et al. 2026, sections 4.4, 4.5 and 5.1. * = load anchor the authors describe as a model estimate with no directly observed data near it. No loads between 53% and 70% 1RM were tested. PI = prediction interval · Full text (PMC) | |||
How to read the result
The direction is consistent, but the size isn't settled. The type II slope was 0.054 SMC for every 10 percentage points of %1RM (95% CI −0.038 to 0.145). The type I slope was −0.005 (95% CI −0.082 to 0.072). Both intervals include zero, which the authors describe as substantial uncertainty about the direction and size of these effects.
“However, the 95% confidence intervals included zero for all pairwise contrasts.”
Varovic et al. · Abstract · full text
The authors offer one reason the combined model came out flat. Across their analyses, type II slopes were compatible with negligible or positive effects and type I slopes with negligible or negative effects. If the two fiber types move in opposite directions, pooling them may partly cancel out any load effect.
The checks kept the direction but not much else. When type II data were limited to studies that reported type II fibers as one group, the slopes shrank to 0.019 for type II and −0.017 for type I, same direction, both intervals crossing zero. Dropping one study at a time, the load × fiber type interaction stayed positive in all eight runs (0.043 to 0.069), and its CI excluded zero in only two. Removing Mackey 2011, the only study that didn't train to failure, gave 0.059 (95% CI −0.017 to 0.134), in line with the other runs.
On the TESTEX quality scale, the most common score was 7 out of 15 (range 6–11). None of the studies reported how they randomized participants or concealed allocation. Residual heterogeneity was moderate, with I² at 69.4%.
What this doesn't tell us
Whether the pattern holds for trained lifters. Six of the eight studies used untrained people, and both studies of trained participants reported negligible fiber growth.
“This makes it difficult to generalize our findings to trained individuals.”
Varovic et al. · Strengths and limitations · full text
What happens at moderate loads. No included study tested loads between 53% and 70% 1RM. The 60% contrast, like the ones at 20% and 90%, comes from the model's line rather than from data near that load.
“Several load anchors included in our contrast analyses (e.g., 20%, 60%, 90% 1RM) therefore represent model estimates with no directly observed data near them.”
Varovic et al. · Strengths and limitations · full text
Women were in only two studies, so there was no analysis by sex. Every biopsy came from the vastus lateralis, so other muscles may respond differently. Most loads are midpoints of prescribed ranges, which the authors call estimates of the actual training loads.
The evidence base is thin. With only 8 studies, the authors didn't formally test for publication bias. The review wasn't prospectively registered, though the data and code are public on the Open Science Framework. Subgroup checks rested on very few studies, for example 3 volume-equated and 5 non-equated, and the authors treat them as hypothesis-generating.
The review measured fiber cross-sectional area, so it says nothing about strength. Only one study stopped short of failure, and the authors say proximity to failure with low and high loads still needs its own research.
How to apply it
The authors don't give training recommendations. They suggest future studies test moderate loads to see whether a load threshold shows up for fiber type-specific growth.
Opinion, not a finding from the paper: If I were in your spot, I would keep choosing loads the way you already do and would not rebuild a program around fiber type on the strength of this review, because every contrast's interval includes zero. If you have an injury or a health condition, this article isn't guidance for that; talk to a qualified professional.
Sources
Source: Varovic et al., Frontiers in Physiology 2026; 8 studies, 195 participants. DOI 10.3389/fphys.2026.1953601.
- StudyVarovic D, Larsen S, Grgic J. Heavy or light: is muscle fiber growth load-specific? A systematic review and meta-regression. Frontiers in Physiology. 2026;17:1953601.
DOI: 10.3389/fphys.2026.1953601 · Full text (PMC, CC BY 4.0)
This is a research explainer for general education, not medical advice.