
Fitness · Research
Repeated resistance training: individual muscle size and strength responses were reproducible, and strength held up better than size during detraining
A 2025 randomized trial followed 20 untrained adults through 10 weeks of resistance training, 10 weeks of detraining and the same 10-week program again. People who gained more muscle size and leg press strength the first time tended to gain more the second time (r = 0.671 to 0.761). During the break, muscle size dropped more than strength.
The short version
This 2025 study in the European Journal of Sport Science tested whether people respond the same way when they repeat the same resistance training (RT) program. Untrained adults did 10 weeks of RT, stopped for 10 weeks (detraining), then did the identical 10-week program again. The researchers measured muscle cross-sectional area (CSA) with ultrasound in the thigh (vastus lateralis) and the upper arm (biceps brachii). They also tested one-repetition maximum (1RM) in the leg press and the biceps curl.
Mostly, yes. People who gained more in the first 10 weeks tended to gain more in the second 10 weeks. The correlations were r = 0.697 for vastus lateralis CSA, 0.761 for biceps brachii CSA and 0.671 for leg press 1RM, all p ≤ 0.001. The biceps curl showed only a trend (p = 0.095).
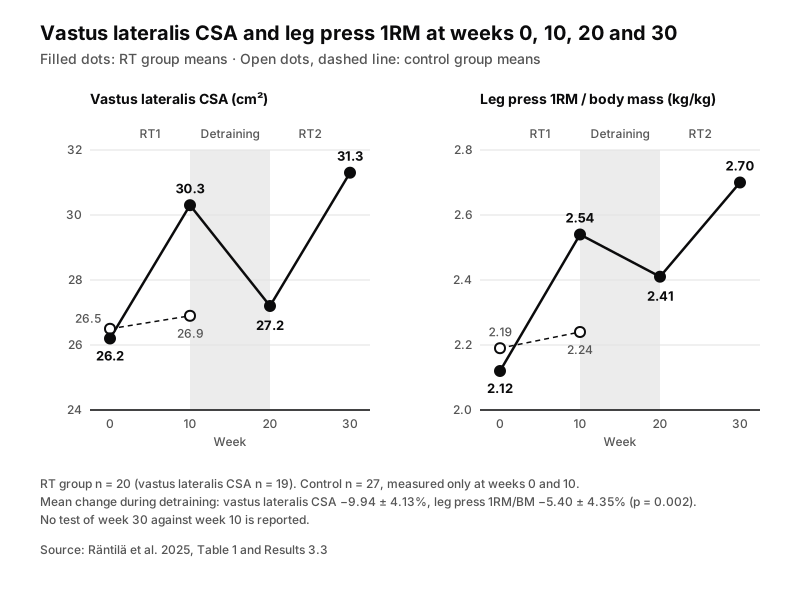
The break showed something else. Muscle size dropped more than strength. Vastus lateralis CSA fell 9.94% on average over the 10 weeks off, while leg press 1RM relative to body mass fell 5.40%. People who gained the most in the first period also tended to lose more during the break. That link was clearest for biceps size (r = −0.673).
“In conclusion, responses to RT are reproducible when RT is repeated, indicating that the individuality of the training response has a physiological origin.”
Räntilä et al. · Abstract · full text
What the researchers did
Earlier work had shown that people's responses to the same RT program vary a lot. Part of that spread could be measurement error or normal biological variation, though. The best way to tell those apart is to run the same intervention twice in the same people, so that is what this team at the University of Jyväskylä in Finland did.
They recruited 55 adults aged 18 to 40 with no regular RT history, meaning fewer than 10 RT sessions a year. Twenty-eight were randomized to RT and 27 to a control group. Twenty people in the RT group finished and were analyzed (11 men and 9 women, age 32.9 ± 5.9 years), along with all 27 controls. Eight people in the RT group dropped out, most of them for health or illness reasons.
The RT group trained twice a week, supervised in the university lab. The exercises were leg press (4 sets), knee extension (4 sets), Smith machine bench press (3 sets), barbell biceps curl (4 sets) and chest supported seated row (4 sets). Every set was 8 to 10 repetitions with about 1 to 2 repetitions in reserve and two-minute rests. The exception was the second session of each week, when the last set of each exercise went to volitional failure. The reps in those sets set the next week's loads. More than 10 reps meant a heavier load, and fewer than 8 meant a lighter one.
The first RT period (RT1) ran from week 0 to week 10. Detraining ran from week 10 to week 20. Participants kept their usual lifestyle but did no RT, no high-intensity activity and no other unaccustomed exercise. The second RT period (RT2), identical to RT1, ran from week 20 to week 30. The control group was followed for one 10-week period without training, so the detraining and RT2 phases had no control group.
Muscle CSA was measured with ultrasound at one marked spot on each muscle: halfway along the thigh for the vastus lateralis, and one-third of the way from the elbow to the shoulder for the biceps brachii. The same researcher took every image, at least 48 hours after exercise. Leg press and biceps curl 1RM were divided by each person's starting body mass (LP1RM/BM and BC1RM/BM).
To separate real responses from noise, the authors used the control group's changes to calculate a minimal detectable change (MDC) for each measure. Someone whose change was smaller than the MDC was classed as a nonresponder for that measure. They also checked whether changes in the RT group varied more than changes in the control group, using a statistic called the standard deviation of individual response (SDIR).
Key findings
| Measure | Vastus lateralis CSA | Biceps brachii CSA | Leg press 1RM/BM | Biceps curl 1RM/BM | Location |
|---|---|---|---|---|---|
| Week 0, start | 26.2 ± 5.9 cm² | 9.1 ± 3.1 cm² | 2.12 ± 0.48 | 0.36 ± 0.09 | Table 1 |
| Week 10, after RT1 | 30.3 ± 7.2 cm² a | 10.6 ± 3.5 cm² a | 2.54 ± 0.49 a | 0.44 ± 0.09 a | Table 1 |
| Week 20, after detraining | 27.2 ± 6.0 cm² a | 9.8 ± 3.3 cm² a | 2.41 ± 0.51 c | 0.43 ± 0.10 | Table 1 |
| Week 30, after RT2 | 31.3 ± 7.3 cm² a | 11.3 ± 3.6 cm² a | 2.70 ± 0.53 a | 0.47 ± 0.10 a | Table 1 |
| Control group, week 0 → week 10 (means) | 26.5 → 26.9 cm² | 8.8 → 9.1 cm² | 2.19 → 2.24 | 0.37 → 0.39 | Table 1 |
| Change in RT1 vs control, weeks 0 to 10 | 16.0 ± 8.4% vs 1.5 ± 4.1% | 17.5 ± 6.5% vs 3.1 ± 2.8% | 21.7 ± 12.6% vs 2.9 ± 4.5% | 25.4 ± 19.0% vs 4.5 ± 6.2% | Results 3.1 (all p < 0.001) |
| Gain in RT1 vs gain in RT2 | no difference | no difference | larger in RT1 (p < 0.001) | larger in RT1 (p = 0.001) | Results 3.1 |
| Minimal detectable change (MDC) | 2.135 cm² | 0.528 cm² | 0.176 | 0.043 | Results 3.1 |
| Individual response variance, SDIR² (95% CI) | 5.114 (0.947 to 9.281) | 0.455 (0.117 to 0.793) | 0.041 (0.014 to 0.07) | 0.001 (< 0.001 to 0.002) | Results 3.1 |
| Correlation, RT1 gain vs RT2 gain | r = 0.697 | r = 0.761 | r = 0.671 | trend, p = 0.095 * | Abstract; Results 3.2; Fig. 4 |
| Change during detraining, weeks 10 to 20 | −9.94 ± 4.13% | −7.27 ± 3.92% | −5.40 ± 4.35% | −3.56 ± 6.76% | Results 3.3 |
| Size loss vs strength loss during detraining | larger than the leg press loss (p = 0.002) | larger than the biceps curl loss (p = 0.031) | – | – | Results 3.3 |
| Correlation, RT1 gain vs detraining change | r = −0.422 (trend, p = 0.072) | r = −0.673 (p = 0.001) | r = −0.488 (p = 0.029) | not reported | Results 3.3; Fig. 5 |
| Source: Räntilä et al. 2025, Abstract, Results 3.1 to 3.3, Table 1. RT group n = 20 (vastus lateralis CSA n = 19); control n = 27. a = significant change from the previous time point, p < 0.001; c = significant change from the previous time point, p < 0.05 (Table 1 footnotes). The control group was measured only at weeks 0 and 10. The correlations for RT1 vs RT2 were all p ≤ 0.001. * The abstract gives r = 0.393 for the biceps curl and Results 3.2 gives r = 0.383. No test of week 30 against week 10 is reported. CSA = cross-sectional area · 1RM = one-repetition maximum · BM = body mass · RT = resistance training · Full text (PMC) | |||||
How to read the result
First, the training worked. Over the first 10 weeks the RT group improved more than the controls on all four measures, all p < 0.001. Vastus lateralis CSA rose 16.0 ± 8.4% with RT against 1.5 ± 4.1% in the controls. Leg press 1RM/BM rose 21.7 ± 12.6% against 2.9 ± 4.5%.
Second, people really did respond differently. Changes in the RT group were more spread out than changes in the control group for all four measures. The 95% confidence limits for that extra spread (SDIR²) stayed above zero each time. Put plainly, the differences between people were larger than measurement error or chance would explain.
Third, those differences repeated. When the same program was run again after the break, gains in RT2 tracked gains in RT1 for both muscles and for the leg press. The biceps curl only trended that way. Strength rose less in RT2 than in RT1 (leg press p < 0.001, biceps curl p = 0.001), while muscle size gains didn't differ between the two periods.
By week 30, the Table 1 means for all four measures were above their week-10 values, for example 31.3 against 30.3 cm² for vastus lateralis CSA and 2.70 against 2.54 for leg press 1RM/BM. That is only a comparison of table numbers. The paper doesn't report a test of week 30 against week 10.
Nonresponders were rare. The paper classed someone as a nonresponder when their change was smaller than the MDC. Some people fell below it in one period or for one measure, but no one fell below it in both periods for more than one measure.
“Only a small proportion of people indicated that they were nonresponsive for a particular characteristic, but no one was nonresponsive for all traits.”
Räntilä et al. · Practical Implications · full text
One sentence in the Results about biceps curl nonresponders is worded unclearly, so this article doesn't quote exact counts.
During detraining, muscle size fell more than strength. Vastus lateralis CSA dropped 9.94 ± 4.13% while leg press 1RM/BM dropped 5.40 ± 4.35% (p = 0.002). Biceps brachii CSA dropped 7.27 ± 3.92% while biceps curl 1RM/BM dropped 3.56 ± 6.76% (p = 0.031). In Table 1, the biceps curl value after detraining (0.43) carries no significance mark.
“Our results support these findings as muscle strength decreased statistically significantly less during detraining than muscle size.”
Räntilä et al. · Discussion · full text
The authors suggest neural adaptations, such as changes in motor unit firing and motor control, as a possible reason strength held up better. They also say neural adaptations were not determined in this study, so that explanation is an assumption, not a measurement.
Bigger gains came with bigger losses. People who gained more in RT1 tended to lose more during detraining. This was significant for biceps brachii CSA (r = −0.673, p = 0.001) and leg press 1RM/BM (r = −0.488, p = 0.029), with a trend for vastus lateralis CSA (r = −0.422, p = 0.072). The authors word the conclusion carefully.
“This suggests that individuals who gain muscle mass to a greater extent may also lose it rapidly when training ceases.”
Räntilä et al. · Discussion · full text
What this doesn't tell us
Whether this holds for experienced lifters, older adults or anyone outside the study group. The authors write that the results “can still only be generalized to healthy untrained younger adults.”
What happens with longer training or longer breaks. Each period lasted 10 weeks.
“It should also be acknowledged that the present RT and detraining intervention periods were relatively short for adaptations to manifest.”
Räntilä et al. · Discussion · full text
How the detraining and RT2 changes compare with no training. The control group was followed only for the first 10 weeks.
How firm the numbers are. Only 20 people were analyzed in the RT group, and only people who completed the study were included. The authors call the sample relatively small for studying differences between individuals. The paper says the study could not be run as a blinded trial. Muscle size was measured with ultrasound at one spot per muscle. The paper doesn't report controlling diet or sleep, and the authors list dietary protein intake, sleep quality and training effort as factors that may add to the variation and should be studied. The paper also has a small internal mismatch: the biceps curl correlation is r = 0.393 in the abstract and 0.383 in Results 3.2.
Why some people respond more than others. The study didn't look for the causes.
How to apply it
The authors list a few practical points. Responses to RT vary a lot between people, and the gains in strength and size go beyond measurement error or normal variation over time. Only a few people were nonresponsive for a particular trait, and no one for all of them. When RT was repeated after a break, people responded in a similar way, and those who had responded more to training lost more during detraining. They don't give a specific program for coming back after a break.
Opinion, not a finding from the paper: If I were in your spot and new to lifting, I wouldn't decide I'm a nonresponder after one 10-week block or from one lift, because in this trial nobody fell short on every trait. If I had to stop for about 10 weeks, I would expect muscle size to drop more than strength, and I would go back to the same program, since the group gained again on it. The study didn't compare other programs, and strength rose less the second time.
A safety note: every session in this study was supervised in a lab, with attention to exercise technique. This article isn't injury or rehab advice.
Sources
Source: Räntilä et al., European Journal of Sport Science 2025; randomized, parallel-group, repeated-measures trial (NCT05553769); 55 randomized, 47 analyzed (RT 20, control 27). DOI 10.1002/ejsc.70095.
- StudyRäntilä A, Halonen EJ, Tiainen EJ, Kaasinen SO, Hulmi JJ, Ahtiainen JP. Repeated Resistance Training Reveals the Reproducibility of Muscle Strength and Size Responses Within Individuals. European Journal of Sport Science. 2025;25(12):e70095.
DOI: 10.1002/ejsc.70095 · Full text (PMC, CC BY 4.0) · Publisher
This is a research explainer for general education, not medical advice.