
Fitness · Research
Muscle growth in males and females: similar relative gains, slightly larger absolute gains in males
A 2025 Bayesian meta-analysis pooled 29 studies in which healthy adult males and females did the same resistance training program. Relative (percentage) increases in muscle size were similar between the sexes, while absolute increases slightly favored males, more so in the upper body.
The short version
This 2025 meta-analysis in PeerJ asked a narrow question. When healthy adult males and females do the same resistance training (RT) program, how does their muscle growth compare? It pooled 29 studies that measured muscle size before and after training.
The answer depends on how you count. In relative terms, meaning the percentage increase from each person's starting size, the two sexes grew about the same. The pooled difference was 0.69%, and its 95% highest density interval (HDI) ran from −1.50% to 2.88%, which includes zero.
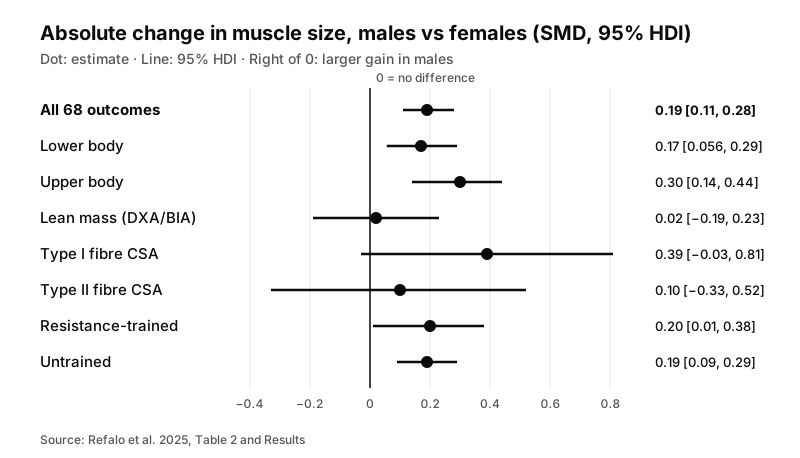
In absolute terms, meaning the raw amount of muscle added, males gained slightly more: a standardized mean difference (SMD) of 0.19 (95% HDI 0.11 to 0.28), pd = 100% (posterior probability of direction). The authors describe that interval as covering a negligible to small effect. pd is the model's probability that an estimate points one way, here toward males. It says nothing about how big the gap is, and it isn't a forecast for any one person.
“These findings therefore suggest comparable muscle hypertrophic potential between males and females following RT.”
Refalo et al. · Discussion · full text
What the researchers did
The team ran a systematic review with Bayesian meta-analysis and pre-registered the protocol on the Open Science Framework. They searched PubMed, SCOPUS and SPORTDiscus and screened 2,720 records. 30 studies met the criteria. Data from one couldn't be retrieved, so 29 went into the analysis.
To be included, a study needed healthy adults aged 18–45, males and females doing the same RT program, and a before-and-after measure of muscle size. That could be muscle thickness, muscle cross-sectional area (CSA) or volume, muscle fibre CSA (fCSA) from biopsies, or lean mass from DXA or bioelectrical impedance analysis (BIA).
The pool held 1,278 male and 1,537 female data points and 68 muscle growth outcomes. Mean age was 26 ± 4 years in both sexes. Programs lasted 6 to 24 weeks, 11 on average. 69% of outcomes came from the lower body (quadriceps and hamstrings), 22% from the upper body (biceps, triceps and chest), and 9% from whole-body lean mass.
Absolute change was expressed as an SMD. Relative change was expressed as a log response ratio (lnRR), then converted to a percentage (Exp. % Change of lnRR). In both, positive numbers mean larger gains in males. Study quality on the TESTEX scale ranged from 9 to 12 out of 15.
Key findings
| Outcome | Absolute: SMD (95% HDI) | pd, absolute | Relative: Exp. % (95% HDI) | pd, relative | Obs. | Location |
|---|---|---|---|---|---|---|
| All outcomes | 0.19 (0.11 to 0.28) | 100% | 0.69% (−1.50% to 2.88%) | 74% (lnRR 0.01) | 68 | Abstract; Results |
| Lower body | 0.17 (0.056 to 0.29) | 100% | 1.04% (−2.03 to 4.2%) | 75% | 47 | Table 2 |
| Upper body | 0.30 (0.14 to 0.44) | 100% | 0.60% (−2.97 to 4.18%) | 63% | 15 | Table 2 |
| Lean mass (DXA/BIA) | 0.02 (−0.19 to 0.23) | 60% | 0.02% (−5.12 to 5.32%) | 50% | 6 | Table 2 |
| Muscle CSA | 0.19 (0.04 to 0.34) | 99% | 0.45% (−3.23 to 4.19%) | 59% | 21 | Table 2 |
| Muscle fCSA | 0.29 (0.11 to 0.47) | 100% | 6.03% (−2.55 to 15.4%) | 91% | 16 | Table 2 |
| Muscle thickness | 0.19 (−0.02 to 0.39) | 97% | 0.35% (−3.25 to 3.93%) | 58% | 17 | Table 2 |
| Muscle volume | 0.19 (−0.08 to 0.45) | 92% | 2.29% (−8.58 to 14.5%) | 64% | 6 | Table 2 |
| Type I fibres | 0.39 (−0.03 to 0.81) | 97% | 12.7% (−6.84 to 34.9%) | 90% | 8 | Table 2 |
| Type II fibres | 0.10 (−0.33 to 0.52) | 70% | −2.29% (−19.2 to 16.7%) | 62% | 8 | Table 2 |
| Resistance-trained | 0.20 (0.01 to 0.38) | 98% | 0.87% (−3.46 to 5.4%) | 65% | 13 | Table 2 |
| Untrained | 0.19 (0.09 to 0.29) | 100% | 0.66% (−1.79 to 3.07%) | 71% | 54 | Table 2 |
| Source: Refalo et al. 2025, Table 2 and Results. pd = posterior probability of direction (how likely the estimate points the way shown, not how large it is). Obs. = observations · Full text (PMC) | ||||||
How to read the result
The gap between the absolute and relative results comes from starting size. Males in these studies usually began with more muscle. Of the 68 observations, only two showed larger baseline muscle size in females. Grow by the same percentage from a bigger base and you add more in raw terms.
“For example, since females start with less muscle mass on average, the absolute increase will be smaller even if the proportional change (i.e., relative muscle hypertrophy) is similar to that of males.”
Refalo et al. · Discussion · full text
Body region changed the absolute numbers. The SMD was 0.30 for the upper body and 0.17 for the lower body, each with pd = 100% (posterior probability of direction). So the male absolute advantage showed up in both regions; the authors conclude it was larger in the upper body (0.30 vs 0.17), though the two intervals overlap and the paper doesn't report a direct comparison between regions. Relative change was similar in both regions (0.60% upper, 1.04% lower), with intervals that cross zero. The abstract's wording reads as if only the upper body favored males, but Table 2 gives the lower body an SMD of 0.17 too.
“However, absolute changes in muscle size of the upper-body slightly favoured males (SMD = 0.30 versus 0.17), may be attributed to larger baseline differences in muscle size between sexes in the upper- versus lower-body (Nuzzo, 2023a).”
Refalo et al. · Discussion · full text
Training experience barely moved the result: an absolute SMD of 0.20 in resistance-trained participants and 0.19 in untrained ones. The trained estimate rests on 13 observations, against 54 for untrained. Measurement method mattered a little. Lean mass from DXA or BIA showed almost no sex difference (SMD 0.02), while direct measures such as muscle CSA (0.19) and fCSA (0.29) leaned toward males. The authors caution that lean mass readings can be affected by shifts in body fluid.
Fibre type results are the least certain. Seven biopsy studies (n = 170) contributed. Type I fibre growth leaned toward males (SMD 0.39, HDI −0.03 to 0.81; relative 12.7%, HDI −6.84% to 34.9%). Type II fibres looked similar between the sexes (SMD 0.10; relative −2.29%).
“However, the 95% HDIs covered wide effect estimates for both absolute and relative type I muscle fibre hypertrophy, suggesting considerable uncertainty in outcomes.”
Refalo et al. · Discussion · full text
What this doesn't tell us
Most participants were new to lifting. The authors classed only 6 of the 29 studies as using people with RT experience, and in some of those the amount of experience wasn't clearly described.
“Given only six of the 29 studies included in the meta-analysis involved resistance-trained participants, further research investigating sex differences in muscle hypertrophy within resistance-trained samples is encouraged.”
Refalo et al. · Discussion · full text
Program variables weren't analysed. The authors had planned subgroup analyses by load, set volume and proximity to failure, then dropped them because studies reported those details too vaguely to extract accurately. They note this as a departure from their pre-registration. So the paper can't say whether males and females respond differently to heavier loads, more sets or training closer to failure.
Sex can't be randomized, so every study compared groups whose muscle size already differed at baseline. On the TESTEX scale, the items for randomization, allocation concealment and baseline similarity were given a point in every study by default, which means the quality scores say less about design than they appear to.
Studies rarely reported the correlation between pre- and post-test values, so the authors assumed r = 0.87. Changing r from 0.7 to 0.99 moved the pooled SMD between 0.17 and 0.22. All fibre data came from the vastus lateralis, the number of fibres analysed per participant ranged from 37 to 374, and type IIa and IIx fibres were combined.
Participants were healthy and aged 18–45, and programs lasted 6 to 24 weeks. The results don't cover older adults or training periods longer than 24 weeks, and they say little about highly trained lifters: one included study, Alway et al. (1992), involved competitive bodybuilders, with 5 males and 5 females. The paper looked at muscle size; strength and performance were outside its scope. The authors received no funding. Three of them (Refalo, Nuckols and Galpin) are coaches and writers in the fitness industry, and Nuckols founded Stronger by Science LLC, as the competing-interests statement discloses.
How to apply it
The authors' practical reading: RT programs can follow similar structures for males and females, with the main differences driven by long-term goals and individual factors such as enjoyment, preferences, and tolerance for discomfort and stress. In the same section they add that short-term responses to training, such as neuromuscular fatigue and muscle damage, may be greater in males and should be considered when prescribing RT. That caveat draws on other studies they cite, not on this meta-analysis.
Opinion, not a finding from the paper: If I were in your spot, I would plan training around goals and preferences, and I would track progress as a percentage of my own starting size instead of comparing raw gains with someone who started bigger or smaller. If you have an injury or a health condition, this article isn't guidance for that; talk to a qualified professional.
Sources
Source: Refalo et al., PeerJ 2025; 29 studies, programs of 6–24 weeks. DOI 10.7717/peerj.19042.
- StudyRefalo MC, Nuckols G, Galpin AJ, Gallagher IJ, Hamilton DL, Fyfe JJ. Sex differences in absolute and relative changes in muscle size following resistance training in healthy adults: a systematic review with Bayesian meta-analysis. PeerJ. 2025;13:e19042.
DOI: 10.7717/peerj.19042 · Full text (PMC, CC BY 4.0)
This is a research explainer for general education, not medical advice.